Introduction
The Manage APIs section is where you create, test, and manage APIs, ensuring they are robust and ready for integration with other systems. The Simulations section is where you run and analyze simulations to validate the accuracy and performance of machine learning models before deployment.
Once you have pushed your deployment configuration you should do some testing to see if the results align with your expectations. There are two ways to test your deployment:
1. Test your API
View APIs
In the Laboratory section of the Workbench, you will find Manage APIs. Here you will find a list of all your deployments.
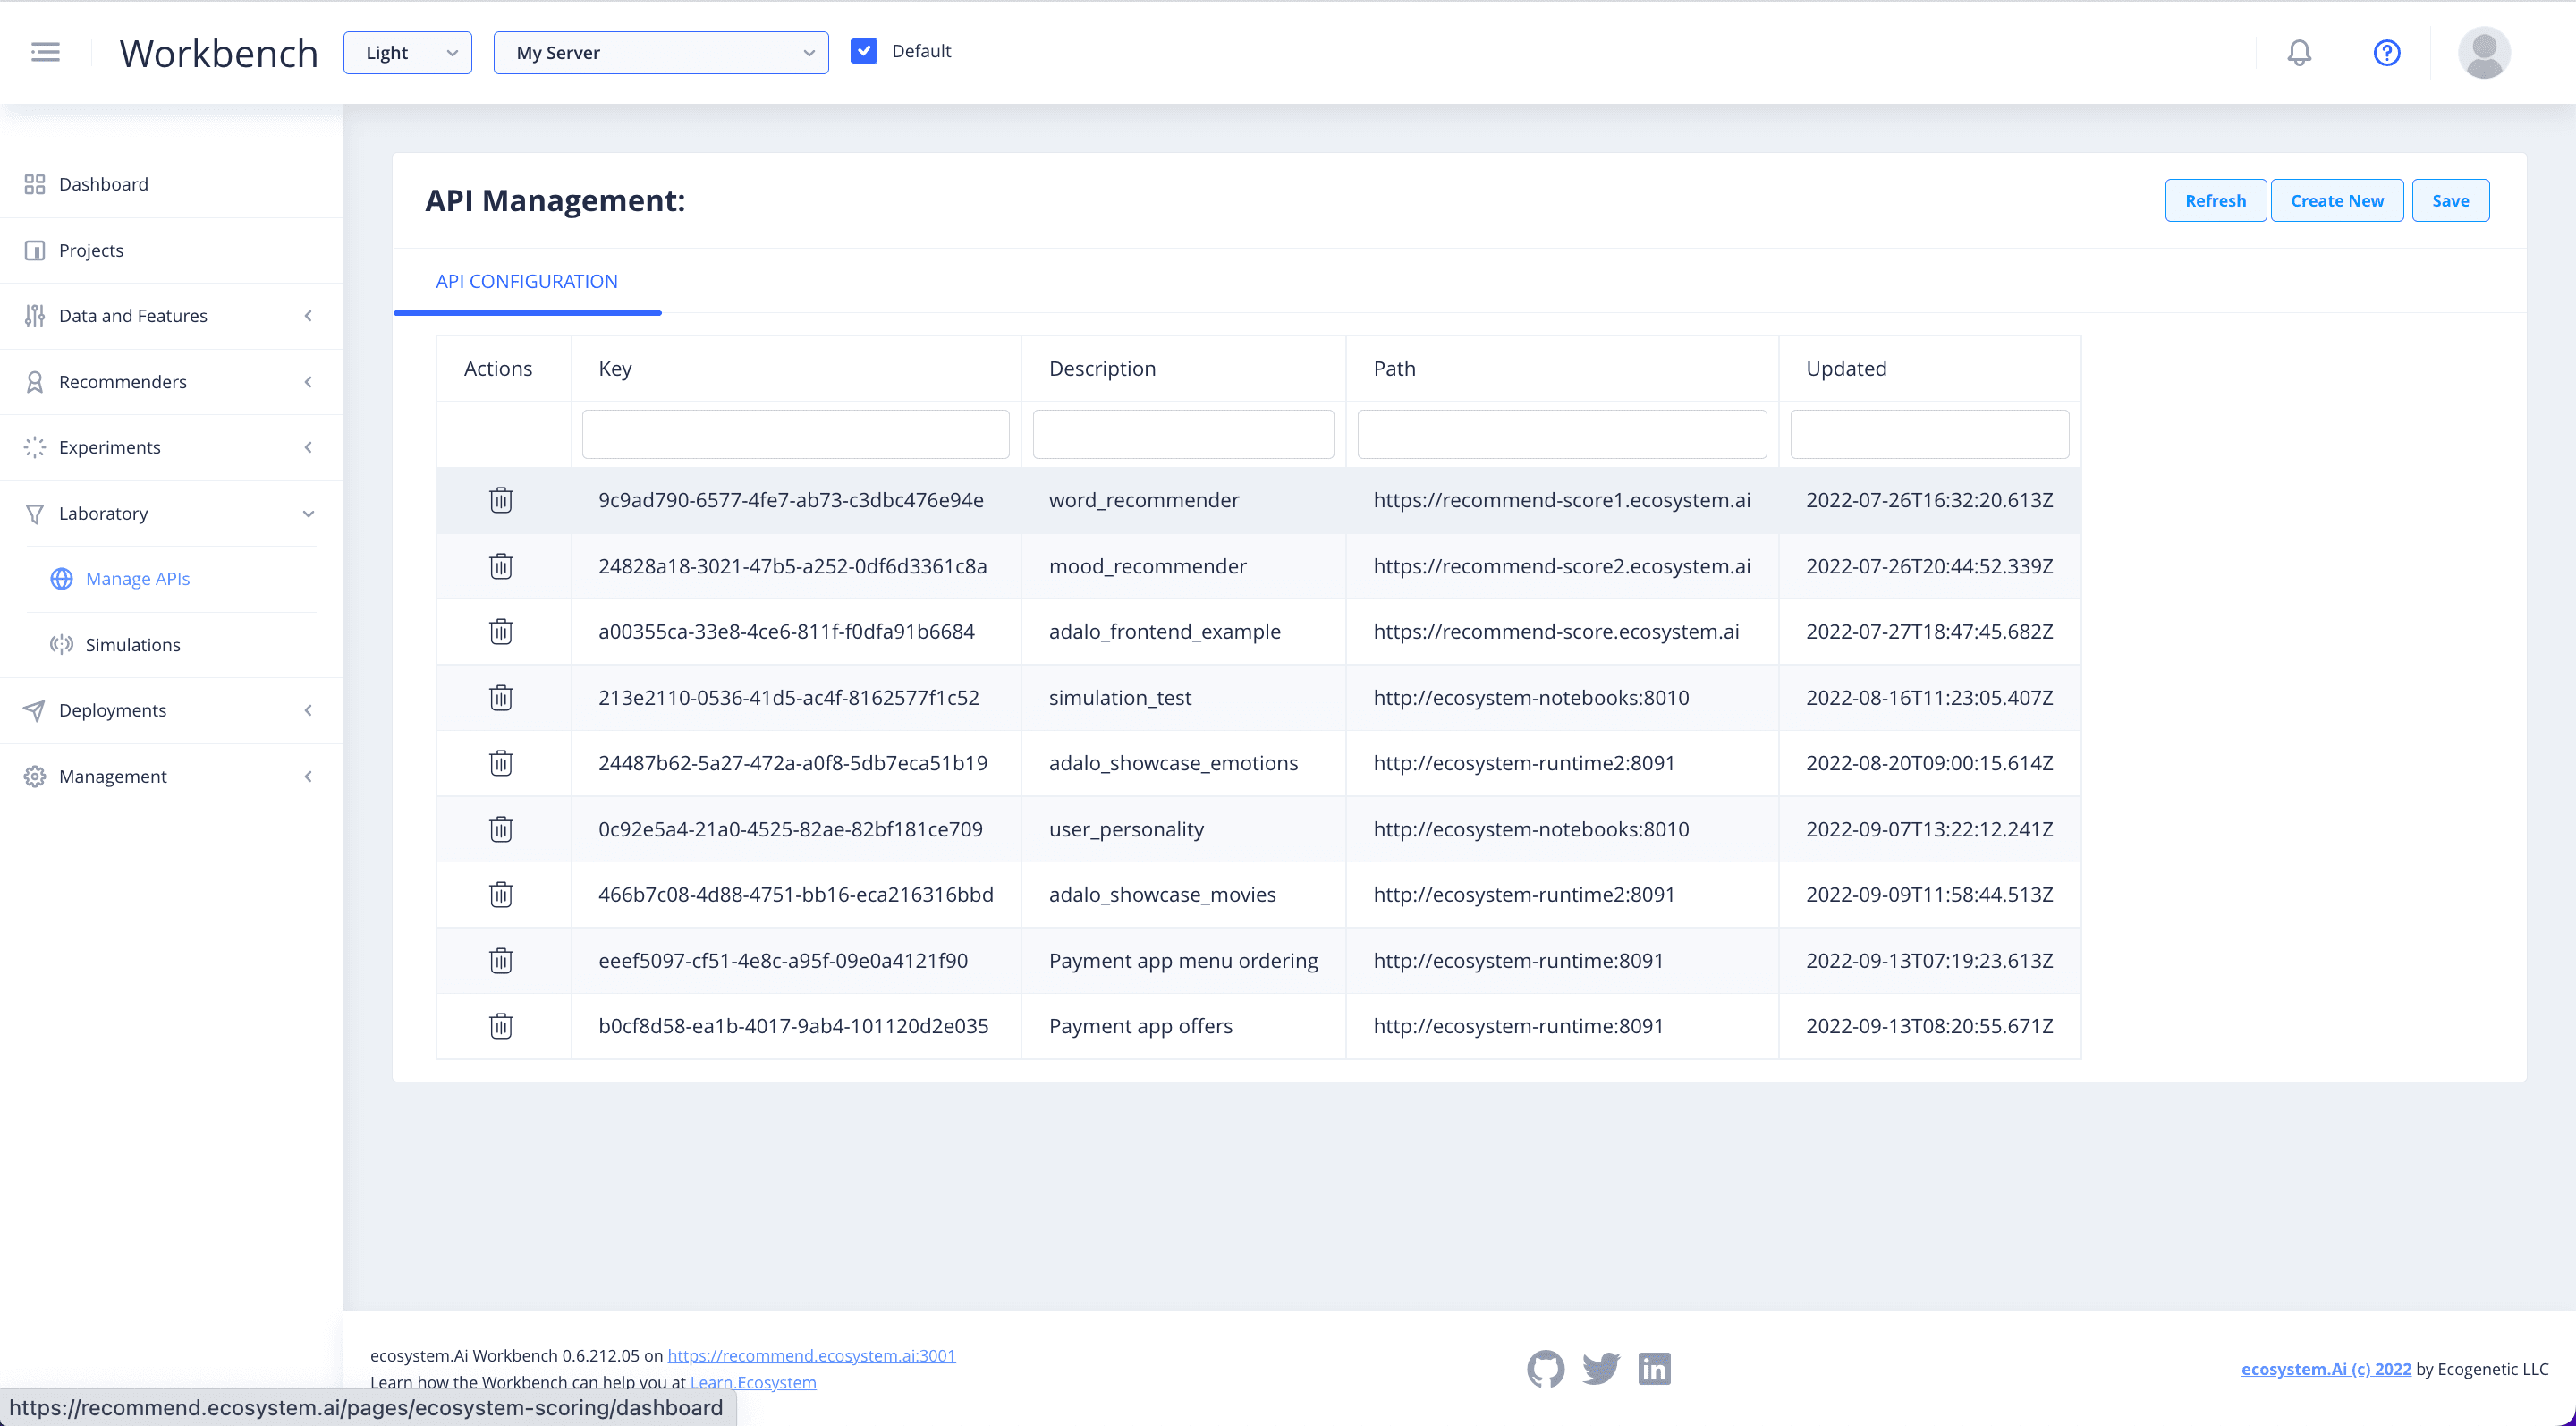
If you have been going through this User Guide using one of the pre-configured examples, click on the relevant deployment to view the details.
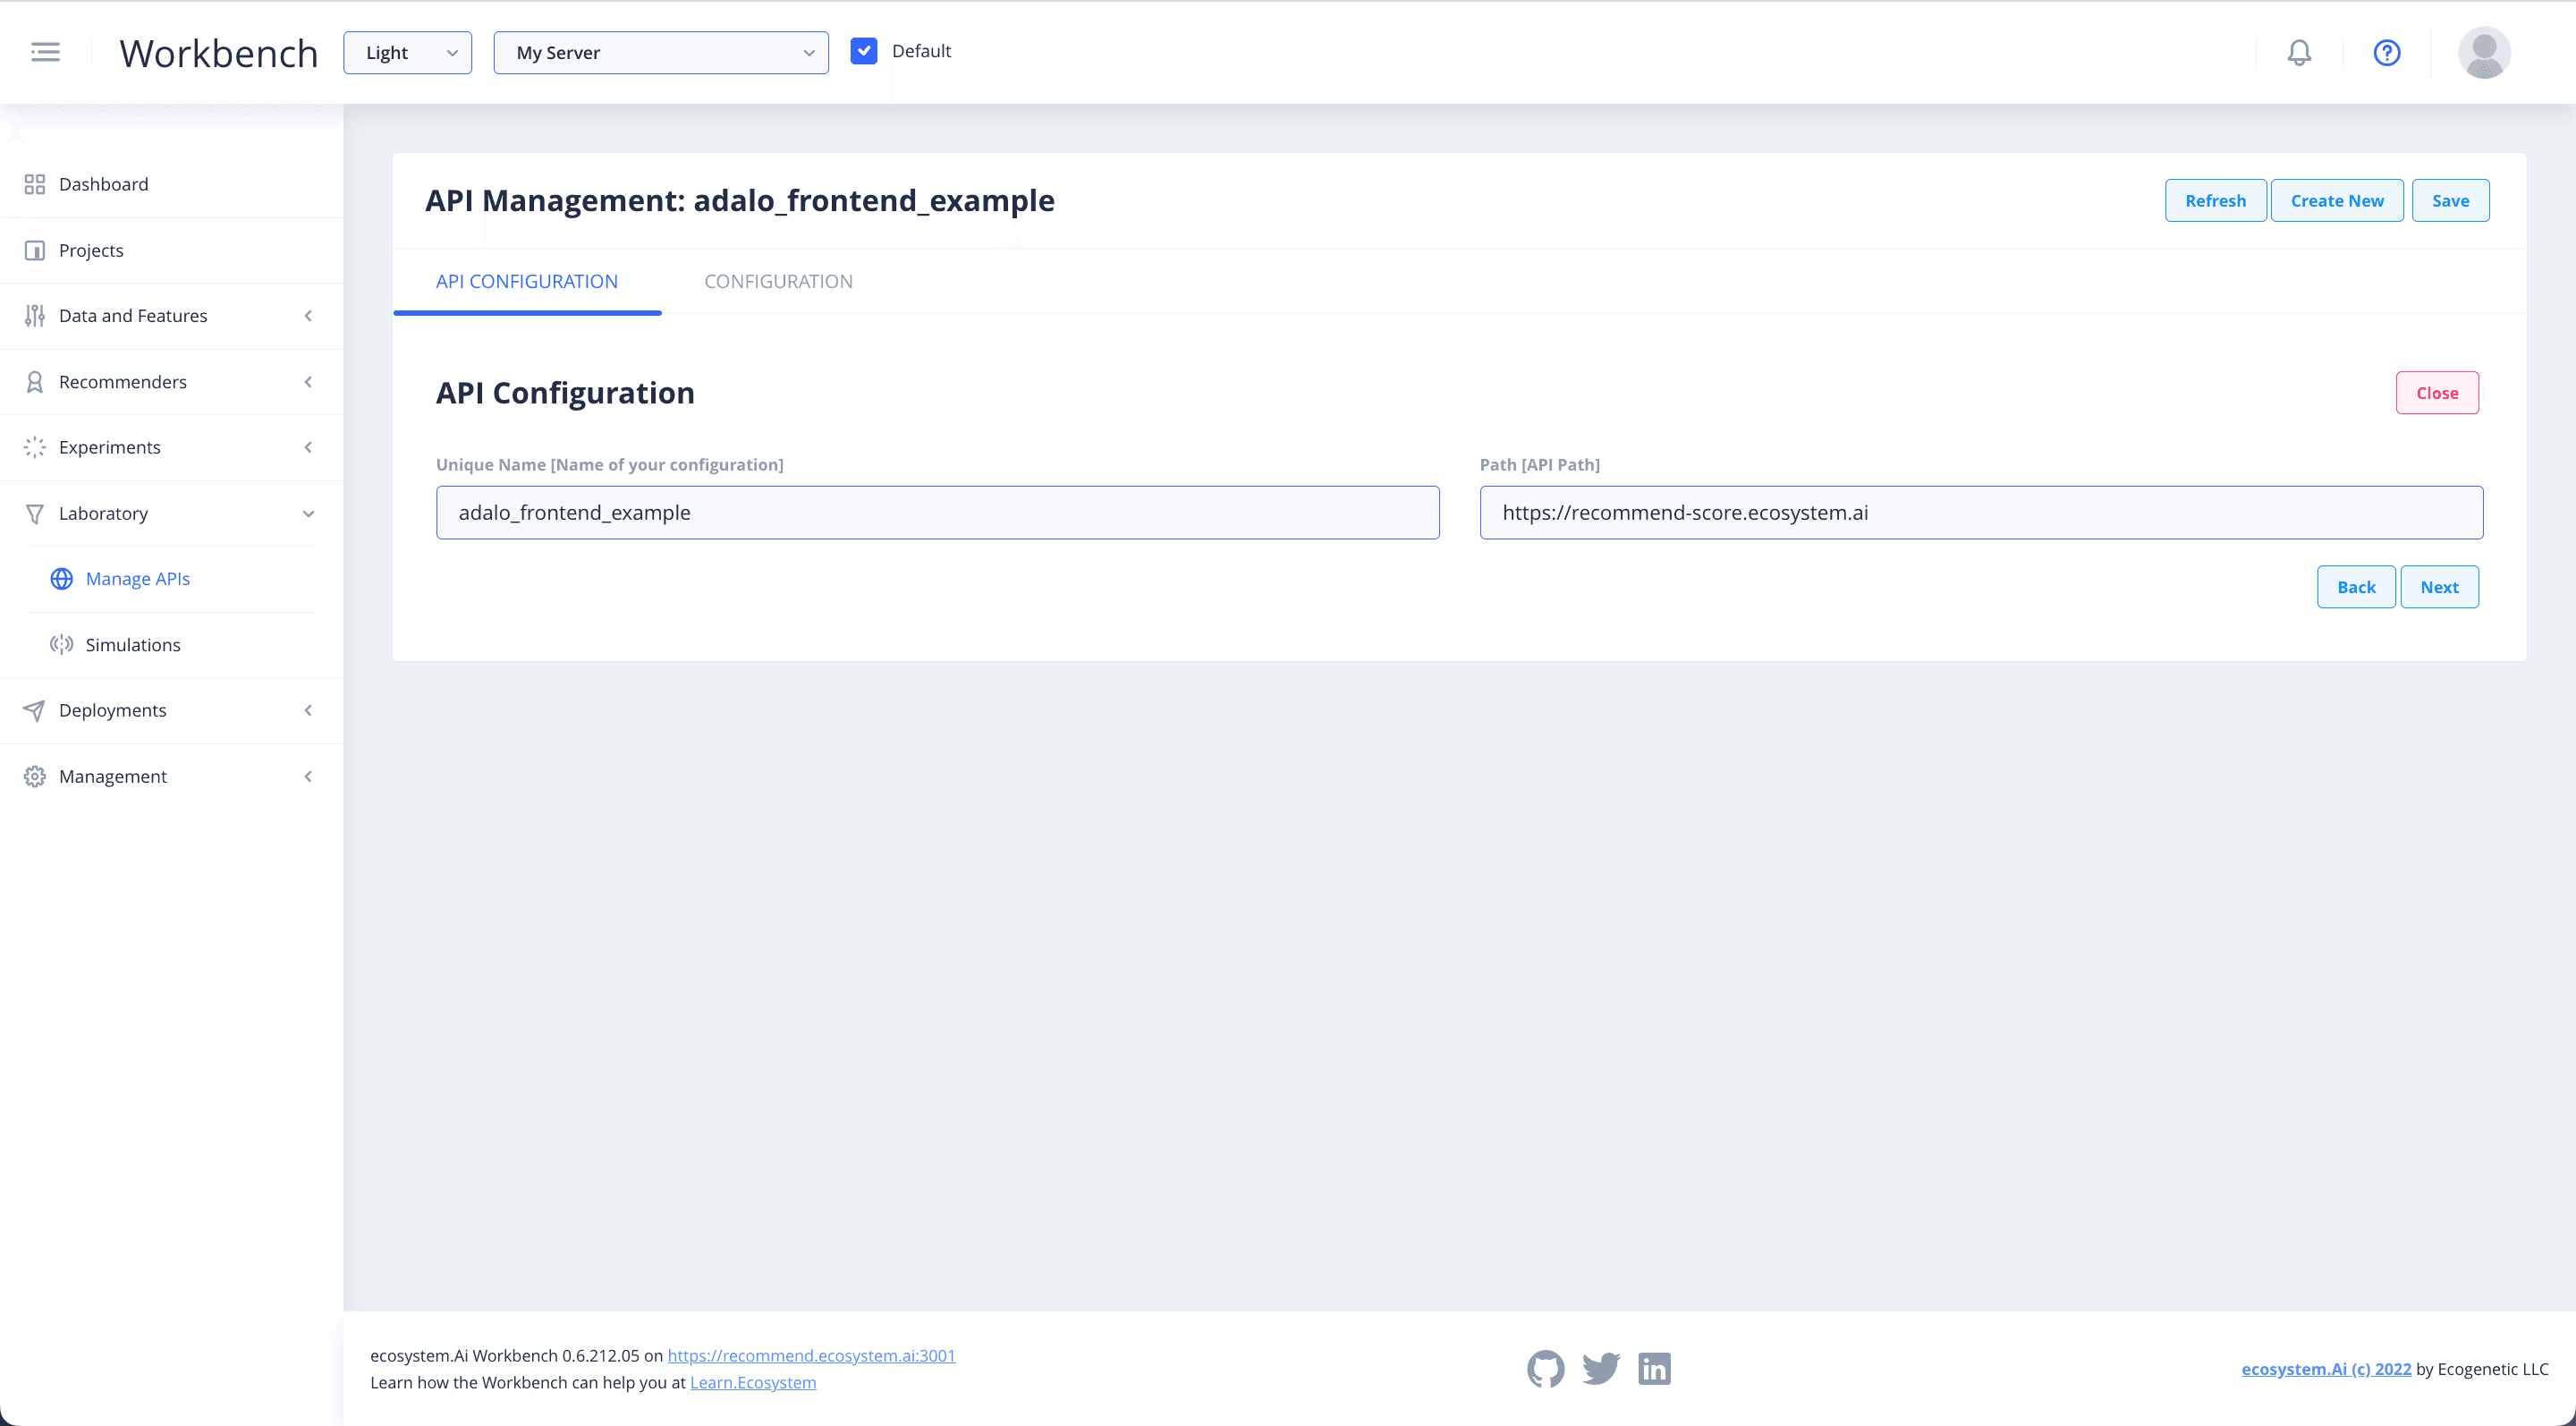
Create API
If you have created your own Project and Deployment, click Create New to make a new API.
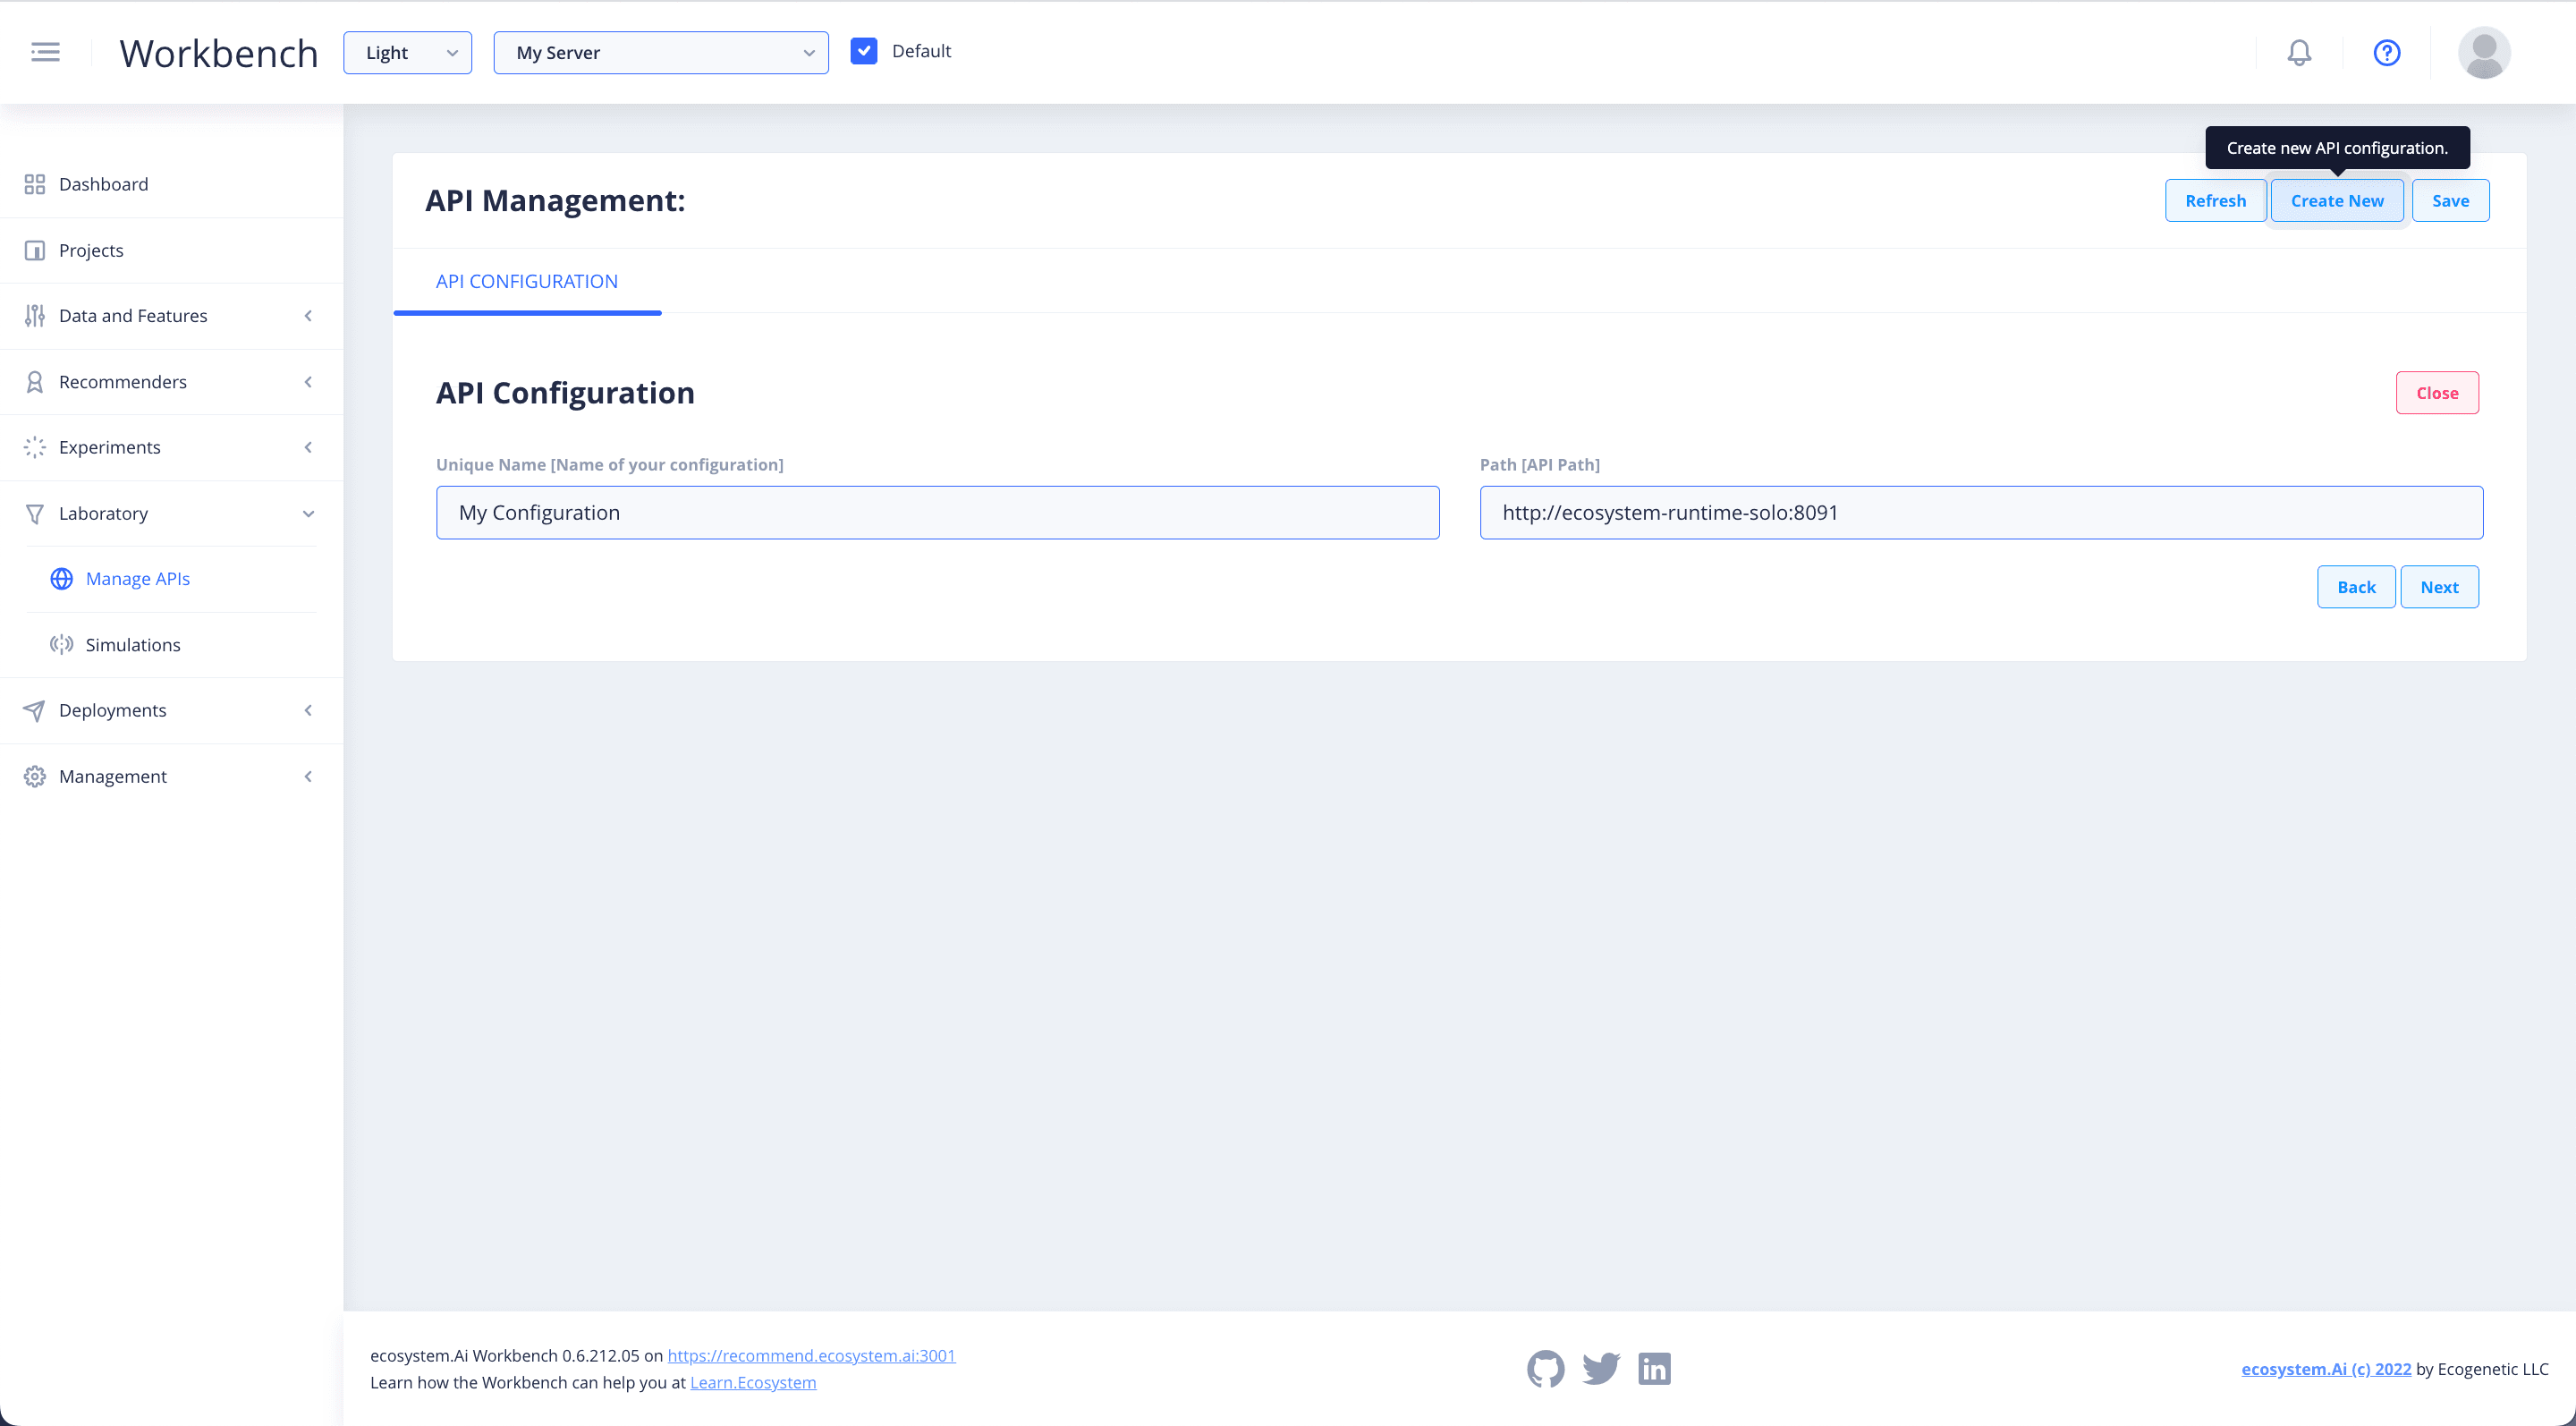
Provide the Unique Name of your deployment and click Next to add it to the list.
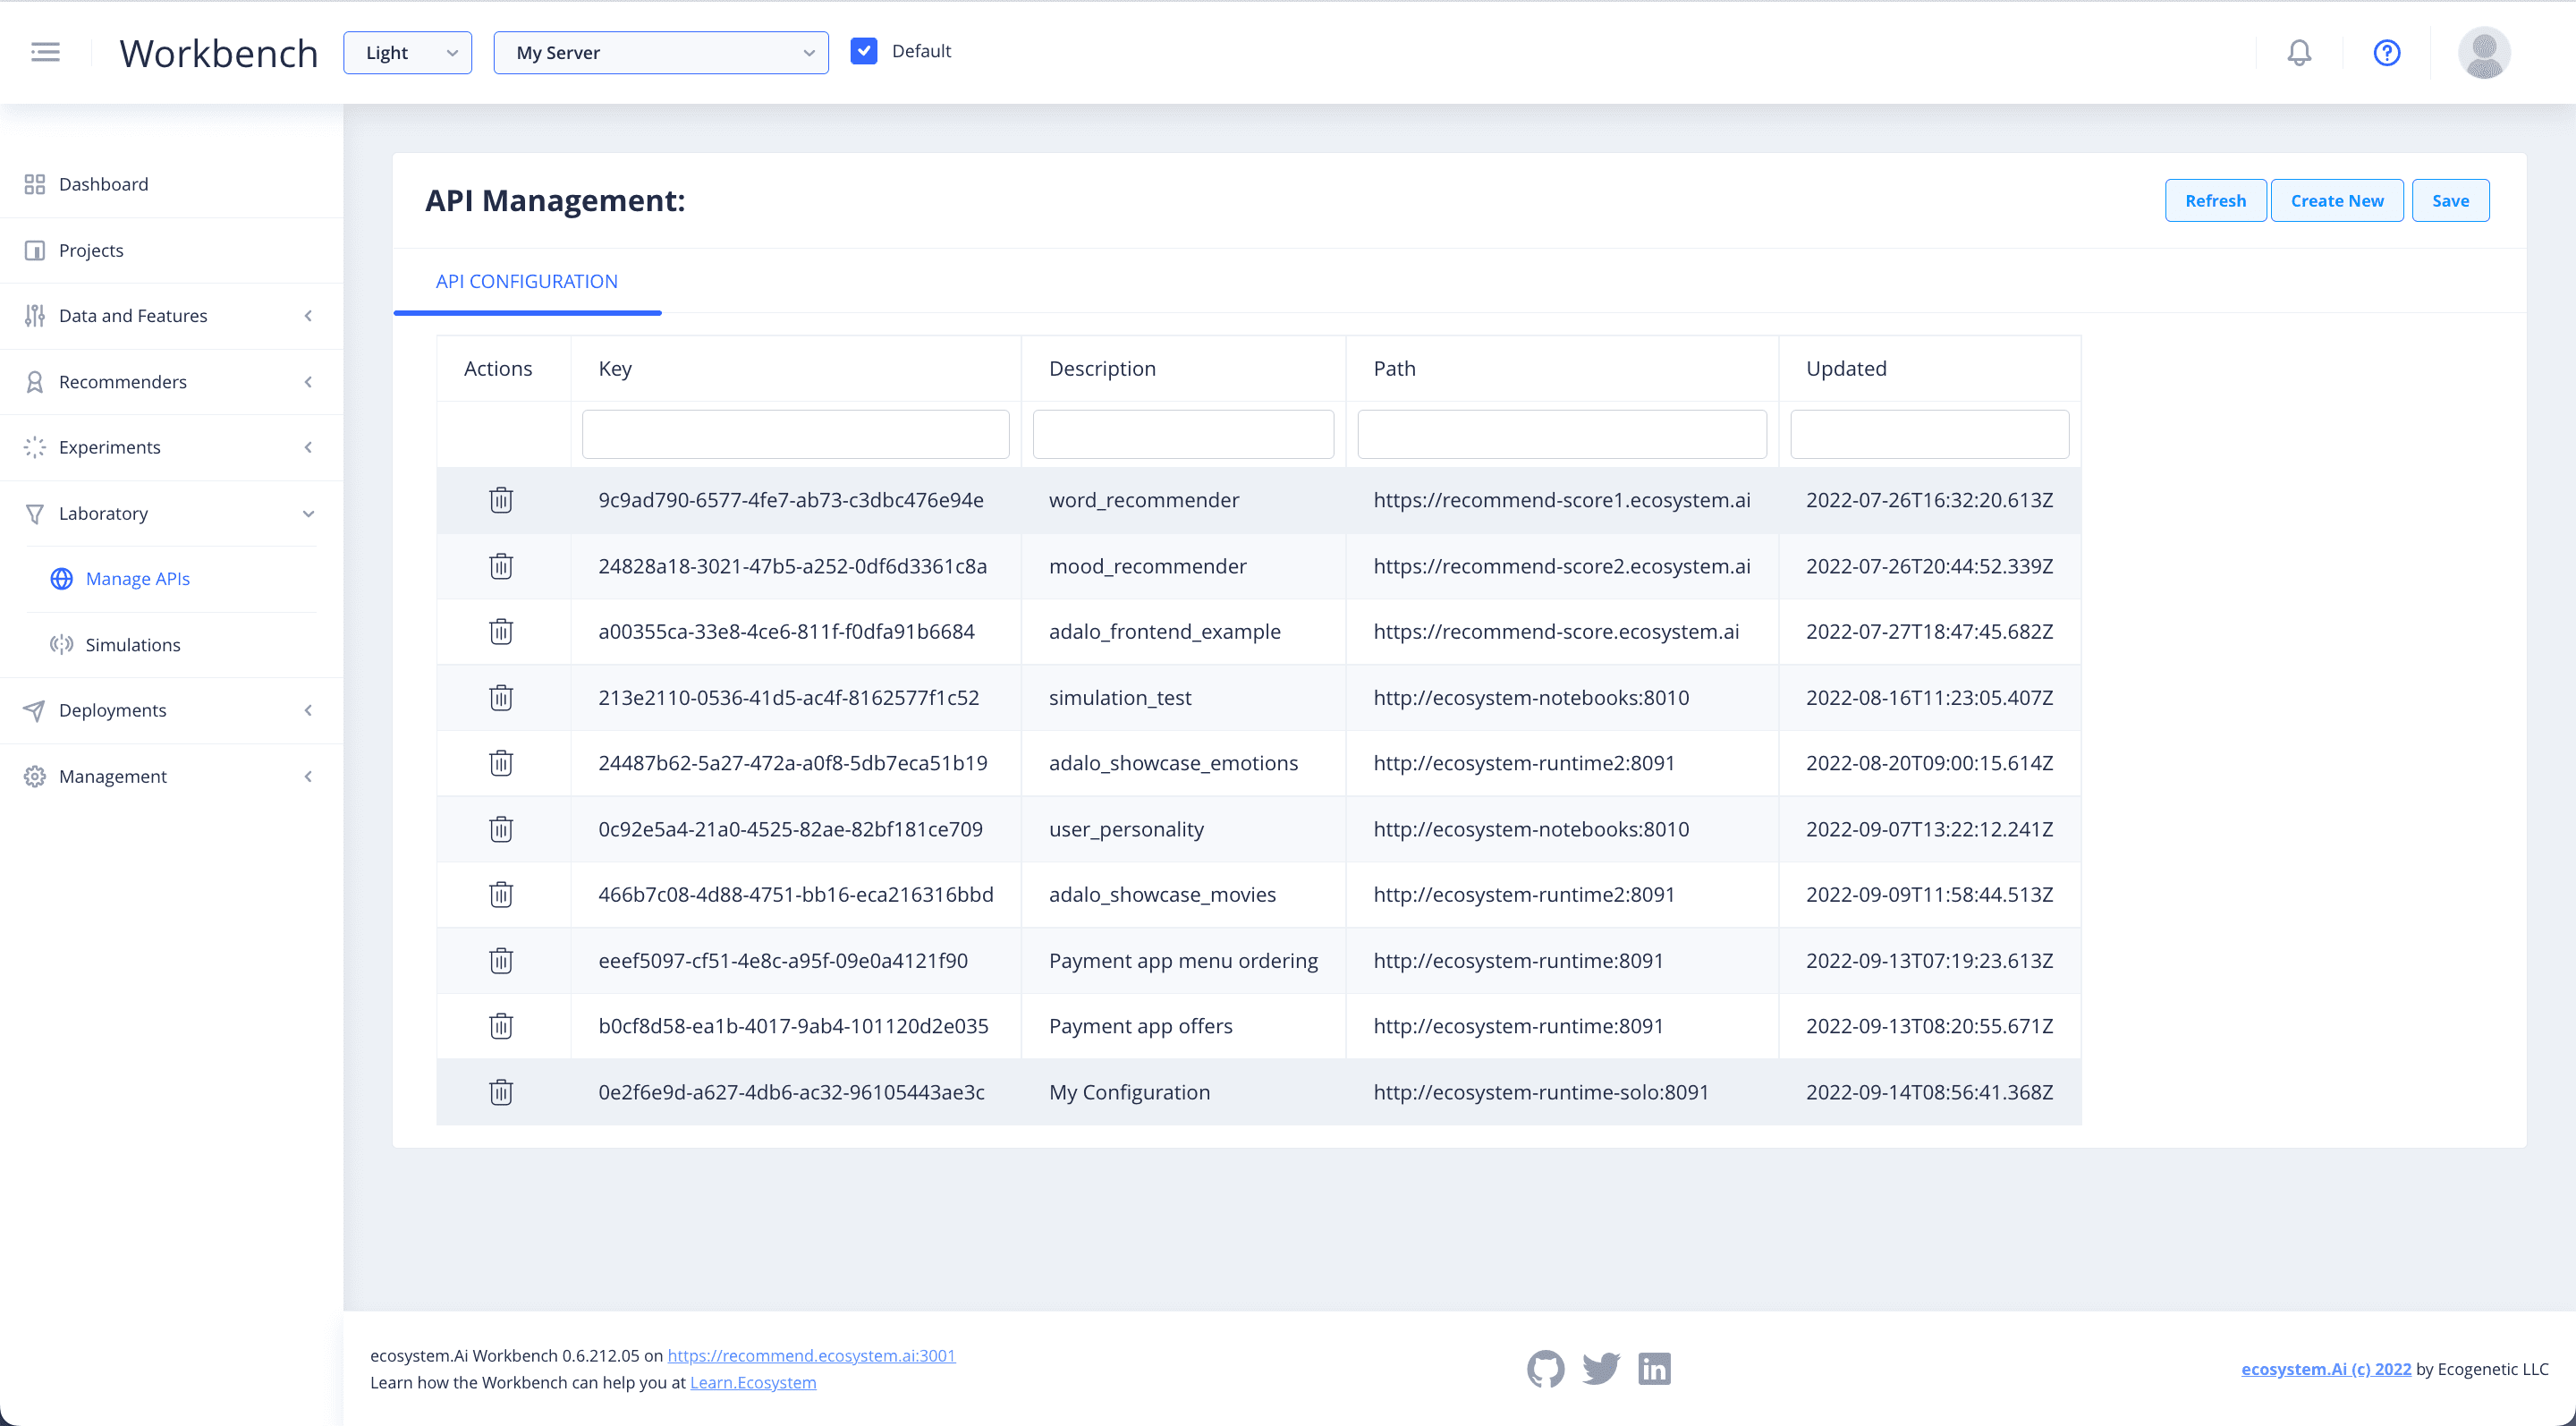
Configure API Test
Select the configuration to view and edit the details of your API. Go to the Configuration tab and select the one you want to test.
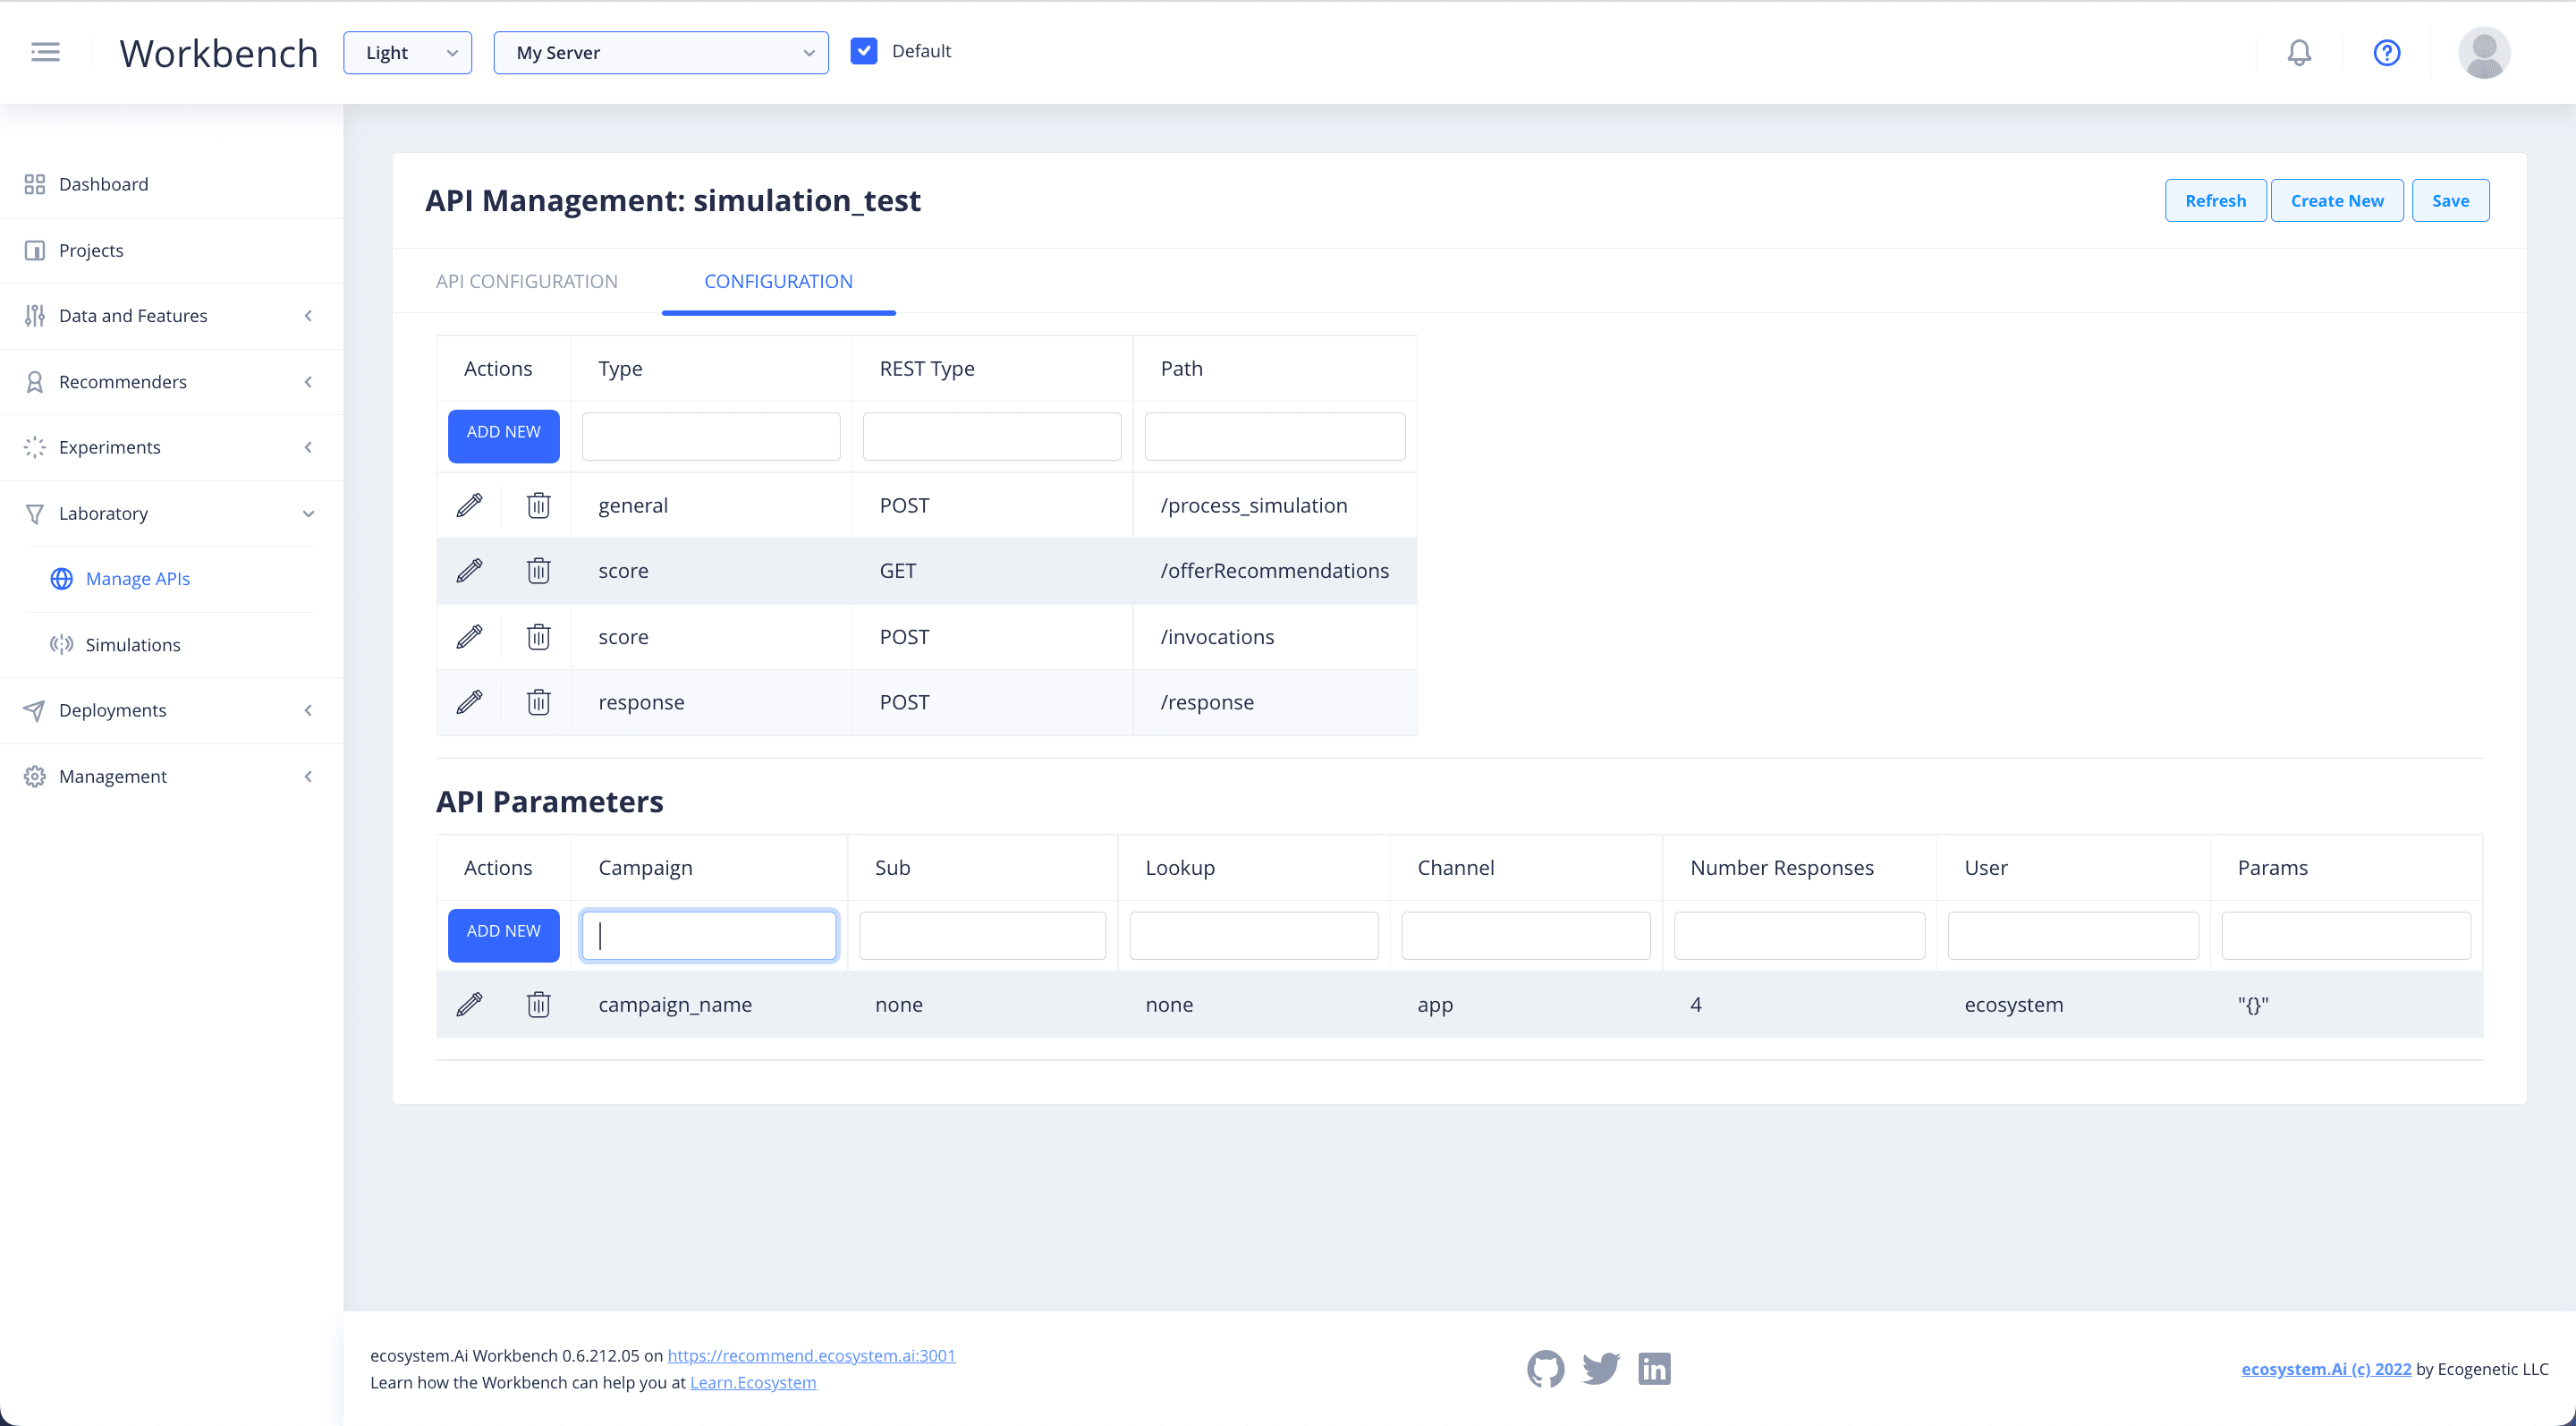
Fill in the relevant details of the campaign, then click on the campaign to bring down the API test window.
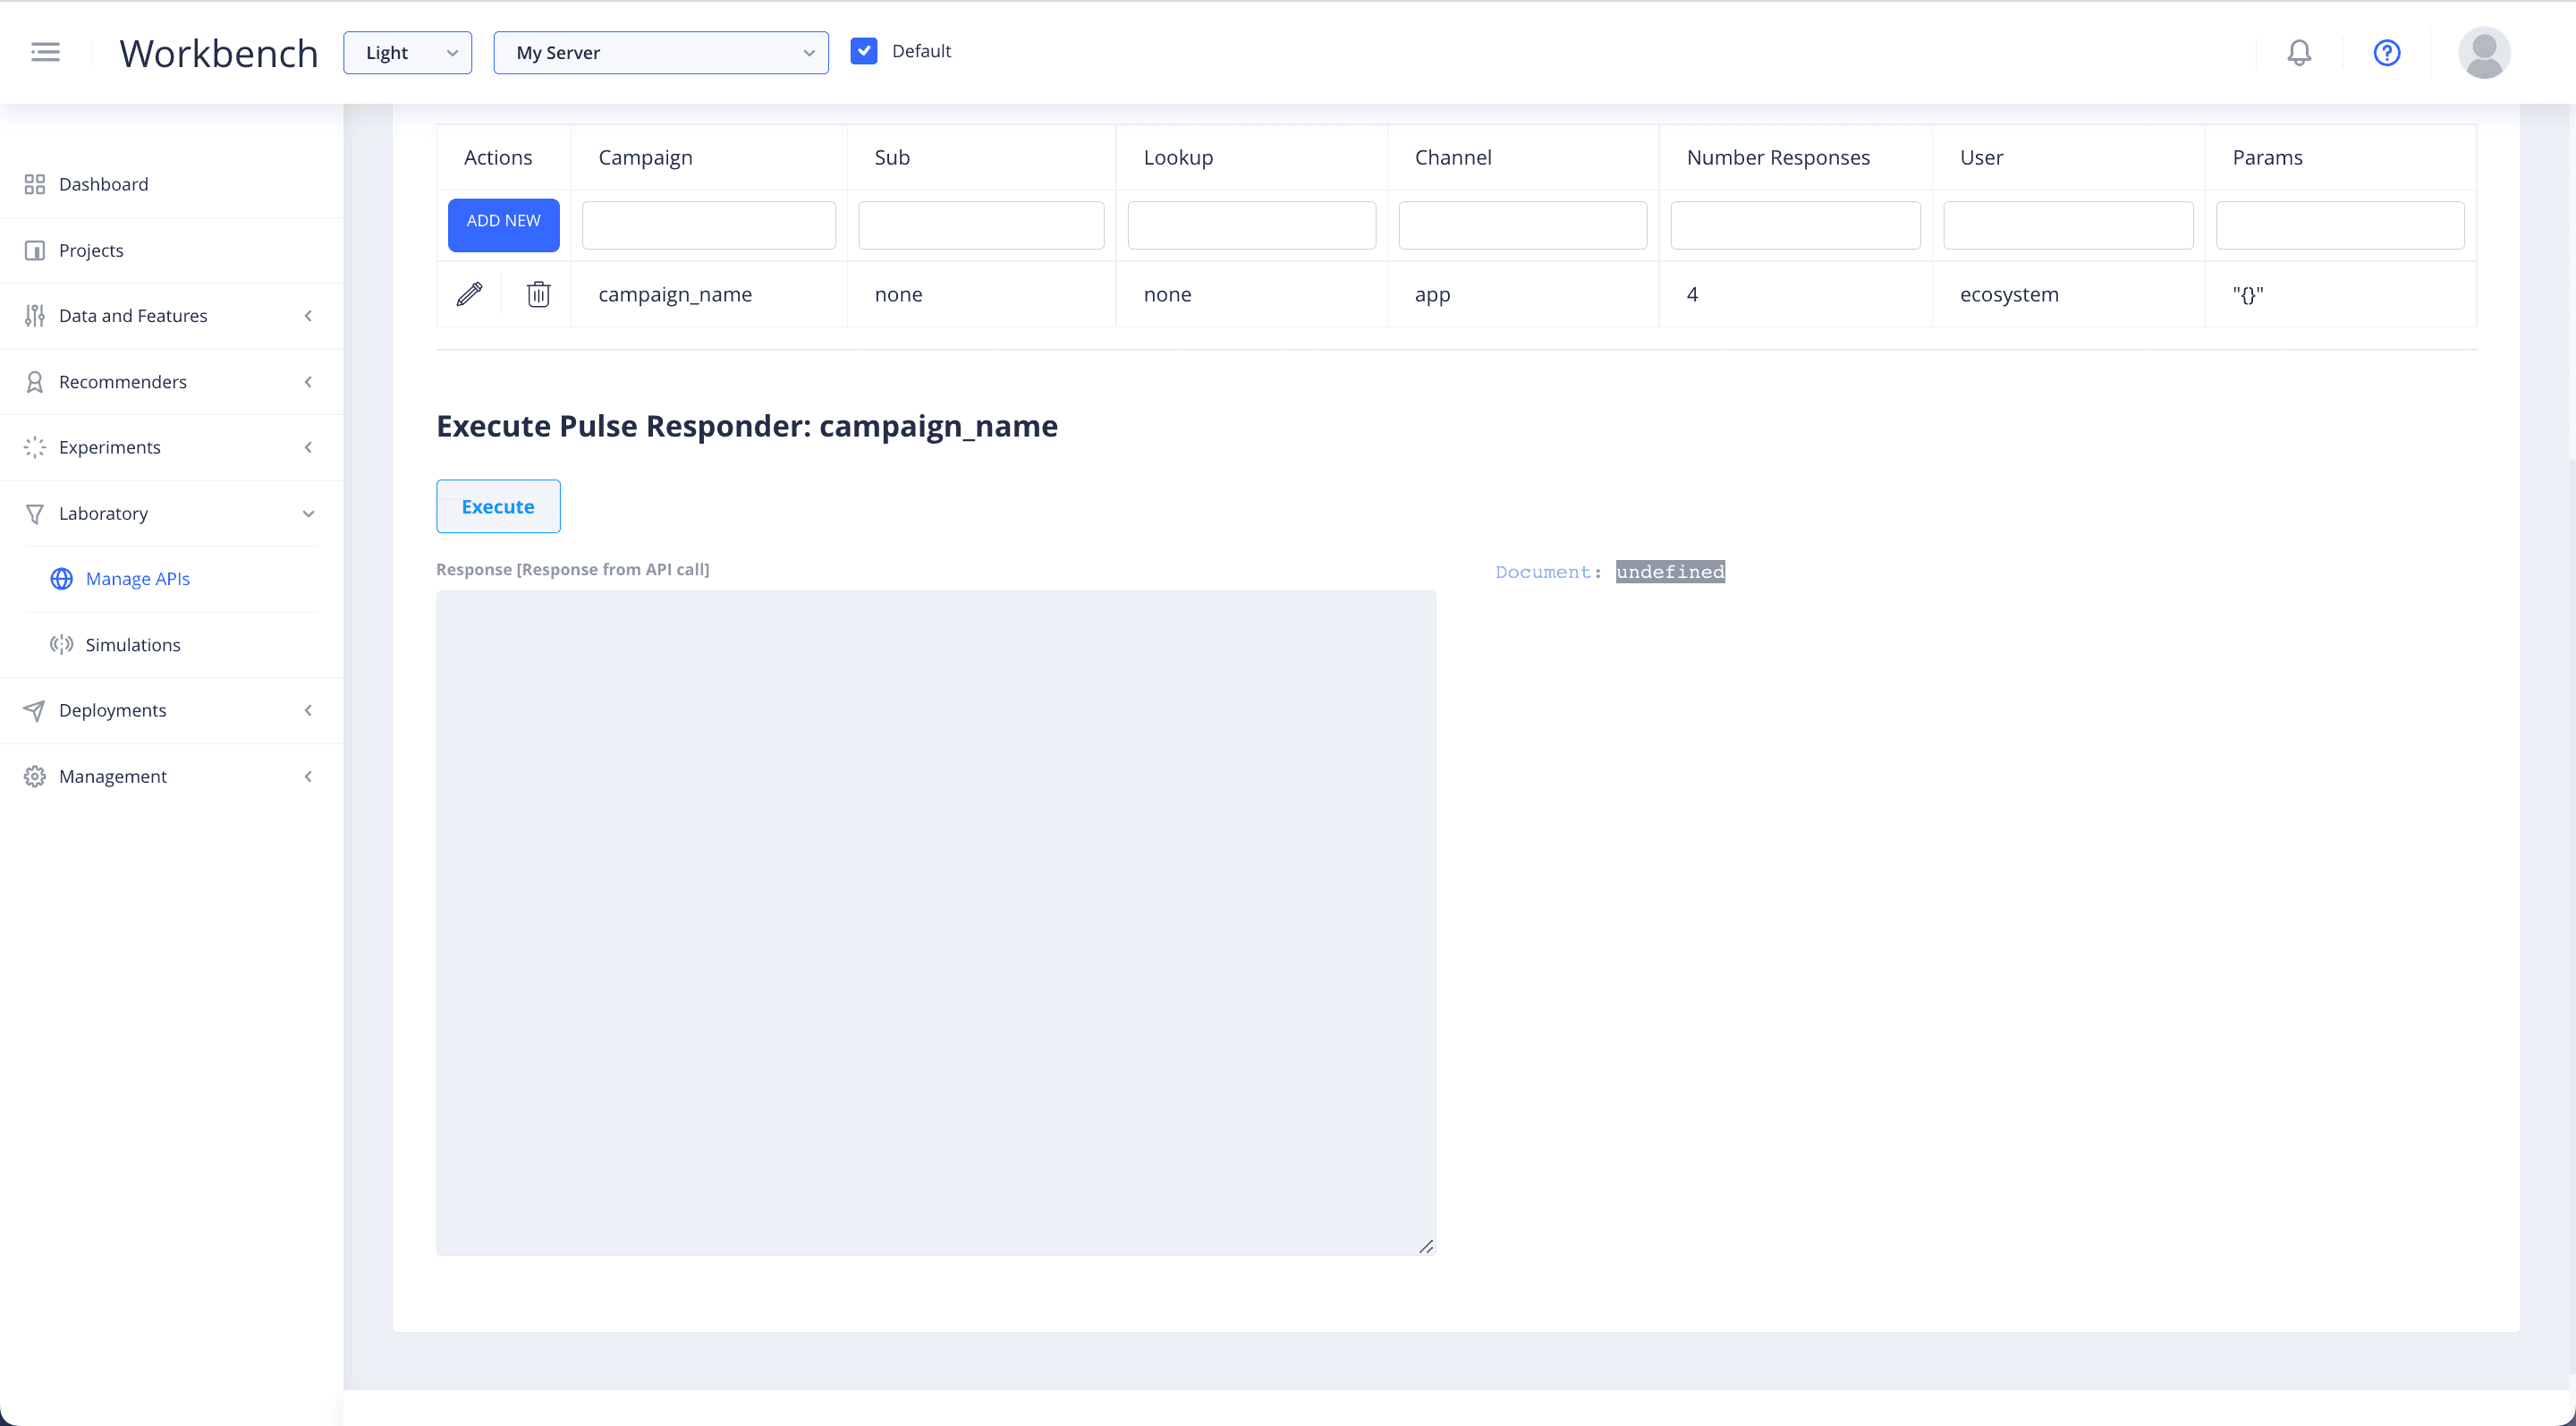
Click Execute to bring back the API results and ensure your deployment is functioning.
2. Build a simulation
Drive closed-loop traffic against the pushed deployment from Workbench 2 Simulation (/entities/simulation): iterations, take-up, connections, logs, and Beta / options-store results.
See Simulations for the current process (Validate connections, nested runs, optional scenario describe). Single-call tests belong on the Runtime Dashboard. To analyze the resulting logs, run an Interactions Analytic job.
The Jupyter notebook worker is no longer the primary simulation UI.